Time to start moving to cash in stocks which u do not truly understand and don't want to stay invested in for 2 years+
A wave down done it was ugly
people panicked.
Just when people were too afraid to enter and we had a second gap down (exhaustion)
bottom formed at 3553 200 dma
What do i expect??
do u really wanna know?
its not pretty the way i see it
go back to your nifty charts 1/30/2004
2 months down from 2014 to 1670
1670/2014*4240
3510 we did only 3553
thats a down , then 1 month up
almost a 70% retracement!!
(1912-1670)/(2014-1670)=70%
Where are we right now?
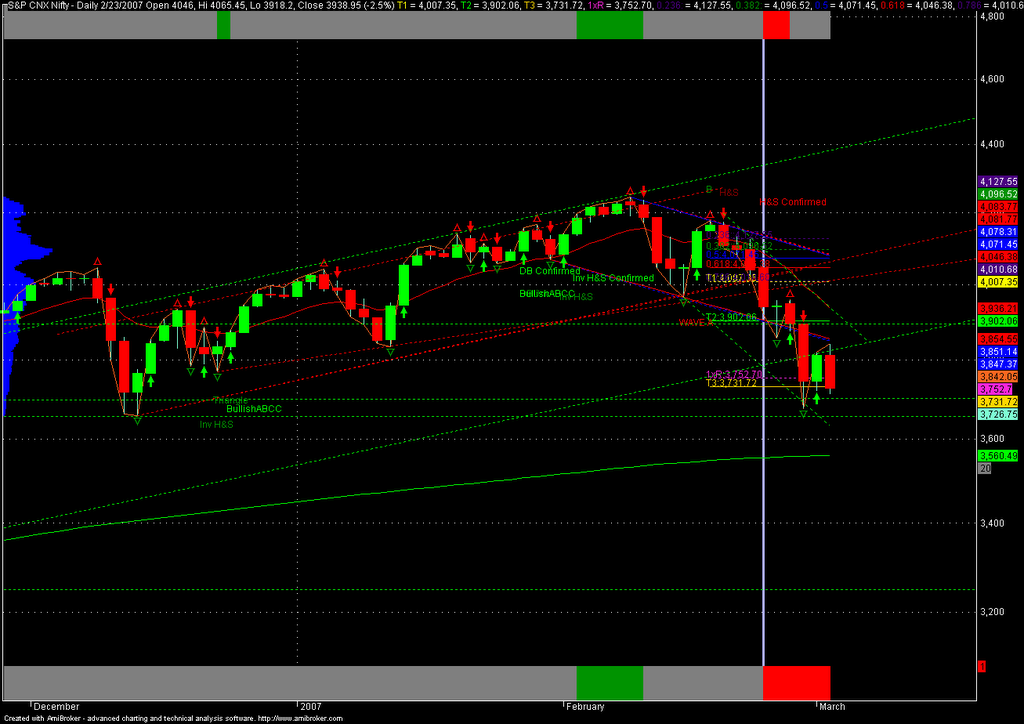
we're gonna do a retracement now which is my wave B
maybe we are in wave a of B or something right now
"7) "B" waves — "B" waves are phonies. They are sucker plays, bull traps, speculators' paradise, orgies of odd-lotter mentality or expressions of dumb institutional complacency (or both). They often involve a focus on a narrow list of stocks, are often "unconfirmed" (Dow Theory is covered in Lesson 28) by other averages, are rarely technically strong, and are virtually always doomed to complete retracement by wave C. If the analyst can easily say to himself, "There is something wrong with this market," chances are it's a "B" wave."
from precther's book
"8) "C" waves — Declining "C" waves are usually devastating in their destruction. They are third waves and have most of the properties of third waves. It is during this decline that there is virtually no place to hide except cash. The illusions held throughout waves A and B tend to evaporate and fear takes over. "C" waves are persistent and broad. 1930-1932 was a "C" wave. 1962 was a "C" wave. 1969-1970 and 1973-1974 can be classified as "C" waves. Advancing "C" waves within upward corrections in larger bear markets are just as dynamic and can be mistaken for the start of a new upswing, especially since they unfold in five waves. The October 1973 rally (see Figure 1-37), for instance, was a "C" wave in an inverted expanded flat correction. "
Worst case levels already given earlier. 2920 is my value area for nifty
out there i am a buyer regardless of what your technicals tell u
most widely accepted targets for hypothetical c wave if it comes
3440-3330-3220-2920-2600
c wave only begins below 3553/200 dma
until then no reason to hit the panic button
For now we trade long and try to hit 3840-3900 region
Thursday, March 08, 2007
Tuesday, March 06, 2007
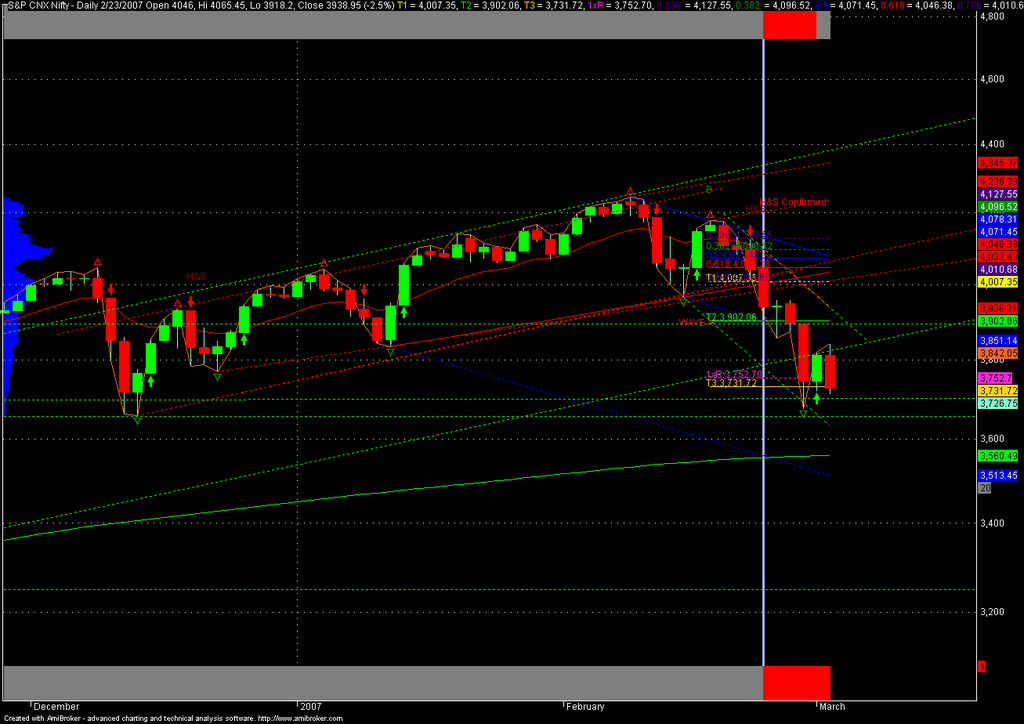
nifty 50:50, trend up or down?? either way 3900-3840 gap down area resistance
Two possibilities for markets right now
bearish wave A down and pullback commencing right now
target 3760-3820-3840-3900 then down much lower till 3440-3330-3220-2900
second more bullish one
c wave of flat ended at 3556
no more new lows
higher to 4440-5550 or so for 5th wave
now even if this 5th of 5th comes
it won't be a straight line 3900 is 50:50 area and will definitely give very very solid resistance
and we certainly won't be going up alone, global markets will need to break out upwards as well
Keep in mind on monthly chartts were are still in w3, w4&w5 left
but a w4 on monthly charts could go as low as may parallel channel
how strong are your long positions?
how long can you hold them?
that determins how u trade
max support comes from 2600/3774*4240 = 2921
thats also nifty value area 13.3x-15x earnings
thats where u should just buy nifty and hold+ hedge by shorting other stocks as needed.
My theory remains that this bull market will top out closer to sensex 20k, nifty 5500-6000
I'm thinking 3556-3900-3400 then 4440++
but lets see, one step at a time, just follow the market
Need help in following??
Use this: http://niftytraders.blogspot.com
Sunday, March 04, 2007
nifty counter trend trade setup
buy 3640 call at 80-70 or near spot price of 3556 whatever call price is at that time hold till expiry, no stoplosses.
target 140-240 before expiry
pure hunch
using the think two steps ahead approach :-?
one step ahead = w5 of wa down will terminate near lower channel/ t1 3556 support/0.5 retrace/200 dma
2nd step = 0.382-0.5 retrace of full rally = 3820-3898
pullback to w4 highs = 3840 target
translate to call price = 180-260 target
+/- premium/discount
min target = gap fill 3720
even then call price target would be 140 before expiry
first gap down below 3965 = w3 breakaway
second=temporary exhaustion
since all weak hands will get taken out
slightly longer term until 3965 is holding nifty will target 3400-3300-3200
for april/may
This long call trade is purely speculative against the trend but at lower channel
On any rally to 3750-3820-3840 buy puts for april
max rally is 3900
so 3800 calls can also be sold on rallies.
in may 2006
wave a down terminated near 2900-200 dma
and a pullback till 3200 came
then again 2900 was lower circuit :)
will we do a circuit first before the pullback??
if we do that circuit then clearly the upside targets would change
and u might have to take a break even on the call
Have a view on the market, but be hedged!
Nifty bullish harami near 3860
Failed to confirm by going above 3965.
I had an extended debate about this with someone.
a) the harami was a near doji hence it denoted uncertainty rather than certainty that market would go up
Even the description of a bullish harami in steve nison's definitive book on candlestick charting is that it often leads to a range rather than a reversal.
So my bullish friend while seeing the bullish harami was ignoring the multiple hns patterns. He refused to see the hns , going to the extent of saying that it was not a hns at all!! Of course I have everything quantified mathematically (the relationship between the left shoulder/right as per my automated pattern recognition system was acceptable)
So anyway what came next??
Instead of rallying above 3965, we broke a declining trendline and did a massive wc/w3 down!!!
I had entered long at 3910 on the day of the bullish harami and when 3965 spot was hit i sold 4050 call for 80 so I was hedged at res.
Next day instead of crossing res!! we started breaking support!!
So of course i shorted below 3880
and hedged by shorting 3800/3760 puts.
I have absolutely no idea what my bullish friends did.
I hope they didn't lose too much though.
As for me I traded the position horribly so the net position is only in a mild profit right now and if I don't watch out soon will have a loss by the end of the month !
since i am short 3760 puts for avg price of 100 and 4050 calls for avg price of 80
and cmp of 3760 put is 100 + rising.
Nifty 50, Trend?? 50:50 !!
3656 area is a big key
market has not done any of the logscale targets for a 5th wave , only the arithmetic objective near 4200 or so has been met.
longer term bull market top near 4400-5550 (p.e of 25-30) is what i would like to see
but for now we follow the trend
Once we break this falling channel and go into a fresh bullish channel we can once again start dreaming of my mega bull market targets of 4440-5550
= sensex
So ultra short term traders following the trend:
3616-3656-3700 support but - > 200 pt falling channel resistance
Keep in mind that it is not 3656 which has to hold to keep this bull market intact even a visit to 3000-2600 would allow for 4440-5550 without ending the longer term bull market , it would just be a mini bear market within a much longer bull market
Market is heavily oversold right now.
Even if you are a bear and u see 5 waves down, what comes next?? (right now what i see from the bear perspective is 1-2-3 down (3rd extended , w4 type of rally soon meaning wa down not even done yet if i were to see things in a bearish fashion)
So now if we go down do a 5th within A wave down we still expect what?
abc pullback? Unless you count a mega extended move forming to the downside??
So I believe a 200 pt rally is coming. But from which support will it come?
If 3676 held pullback till 3876 +/-40 pts
if 3656 held pullback till 3856 +/-40 pts
If 3600 held pullback till 3800 +/-40 pts
Its just not feasible to be bearish on nifty at such oversold levels.
Now if you are a bear you will look to go short near falling 200 pt channel
sl levels for bears = 3965/4177 (w1 of a ka bottom or w2 of a ka top)
Remember the bullish count is that the decline is a 5 wave c of a flat.
But we really need to hold 3600 to keep the bullish structure of the market intact.
Now because we have these 2 opposing forces
The worst case possibility is a H&S top on nifty
meaning 3656-3600 could hold u could get a secondary relief rally then the bigger c /3 down
Best case scenario is 3600 will not break and market will just go up into a fresh bull move and do my bigger tf w5 bull market targets
To see the fundamental value area of nifty consult my old post
http://fnocharts.blogspot.com/2006_12_01_fnocharts_archive.html
fundamentally stock market doesn't look topped
However its not exactly at a gr8 value area also
value area on technicals is that 30% rising channel
around 14x current earnings 2900-3100 or so nifty spot.
for longer term investors
http://fnocharts.blogspot.com/2006_11_01_fnocharts_archive.html
keep in mind 20k is intact till july lows of sensex hold and however damn bearish you are it is not gonna be easy to break those panic lows!!
Subscribe to:
Comments (Atom)