Saturday, November 18, 2006

India's First!? Computerized Pattern recognition system

Here is my latest work. I'm fairly sure no one else has gone down this route yet in India anyway. For ms and Amibroker you can already purchase pattern recognition systems on the web (U.s/European vendors)
I find that making a loss in the market is great motivation to try out something new and make something better. (I recently had a loss in chennpetro :))
Most people have ridiculed my mechanical approach at one point of time or another. When it comes to Trading system development/testing I have actually recieved more help/encouragement from my few friends in Europe than the many (online) friends in India.
I guess us Indians are more emotional than logical. Acting on cold hard facts and patterns would not be our forte. We would put in the emotional gut feel trading style in it anyway :). I have a mixed upbringing, partially western and partially desi in my values hence I seek the middle ground. A mechanical system is fine for guidance but it should be designed in such a way that it can be followed without major emotional excesses (ex. a system which has a drawdown >10-20% is not very easy to follow :))

For now my first step will be to just use this scanner as an advisor for interesting trades which could be taken. I am keen to collaborate with a fundamental analyst who can quickly give me a summary of the fundamental trend for a stock so that we can decide on whether to trade the chart pattern or not.
Keep in mind this is only a chart pattern recognition system. It is not a complete trading system yet since it does not incorporate risk management. That will be my next project.
Maybe after I make my next big loss. Perhaps I should work on the risk management part right now to avoid the next big loss :).


Backtest results
Backtest is done on nifty-I
results are 528% long+short
during the same period buy and hold = 1400-3900 = 274%
i sense a winner here :)
Keep in mind 528% is long+short with 1x leverage if u have more risk appetite u can pyramid and do all kinds of other stuff.

If you have ideas for a chart pattern recognition system do buzz me on yahoo:rajak1981@yahoo.com. I'm always looking to improve/add new features.
Nothing will ever beat the human eye when it comes to recognizing patterns. This system is likely to miss out some signals. On the other hand the main problem with 'eyeing a chart' is that you might not be able to backtest your strategy as rigorously as a well defined mathematical system.

Thursday, November 16, 2006

Gann Fan Madness


I have no clue how gann fans work.
If someone has an insight into fans + gann squares do buzz me on yahoo: rajak1981@yahoo.com

Experimental Afl
Brute force lots of fans being drawn from lots of pivots :)


Gann used to live in the age of few pts up + few pts down.
It was his assertion that his gann square going till 1000 or so would be plenty :D.

We're in the age of stocks going beyond 1000,2000,3000
So i am debating making a logarithmic adaptation of the basic gann fan.
The idea is to make the gann fan line move up a fixed % per day instead of a fixed # of pts.

Gann fanns for nifty using 6 pts per day


looks funny on log scale :)

Wednesday, November 15, 2006

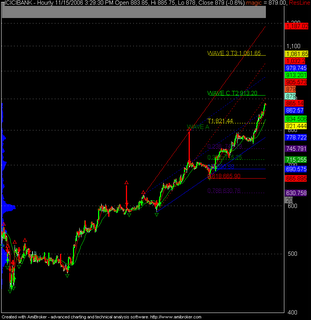
Spike Filtering in amibroker!!


With spikes


Without spikes!!

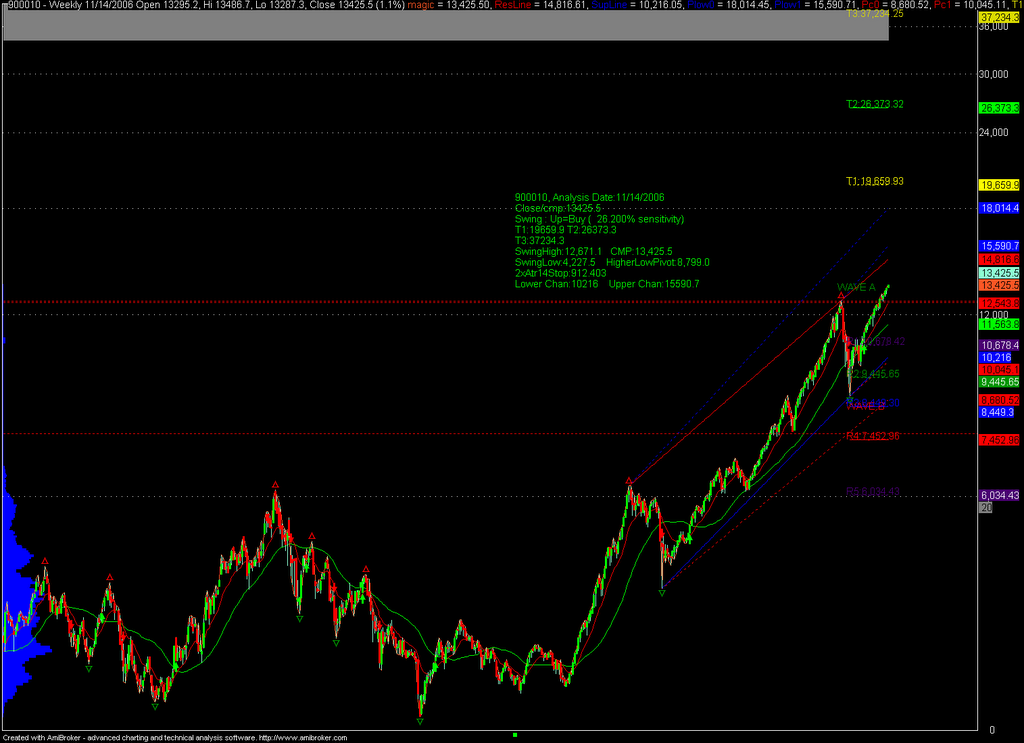
Sensex longer term target of 20-36k just opened for investors


Sensex targets for investors???
Follow the log channel
sl below channel or last pivot??
targets active until last pivot is broken to the downside thats 8800 :)
obviously too far away :)

Tuesday, November 14, 2006

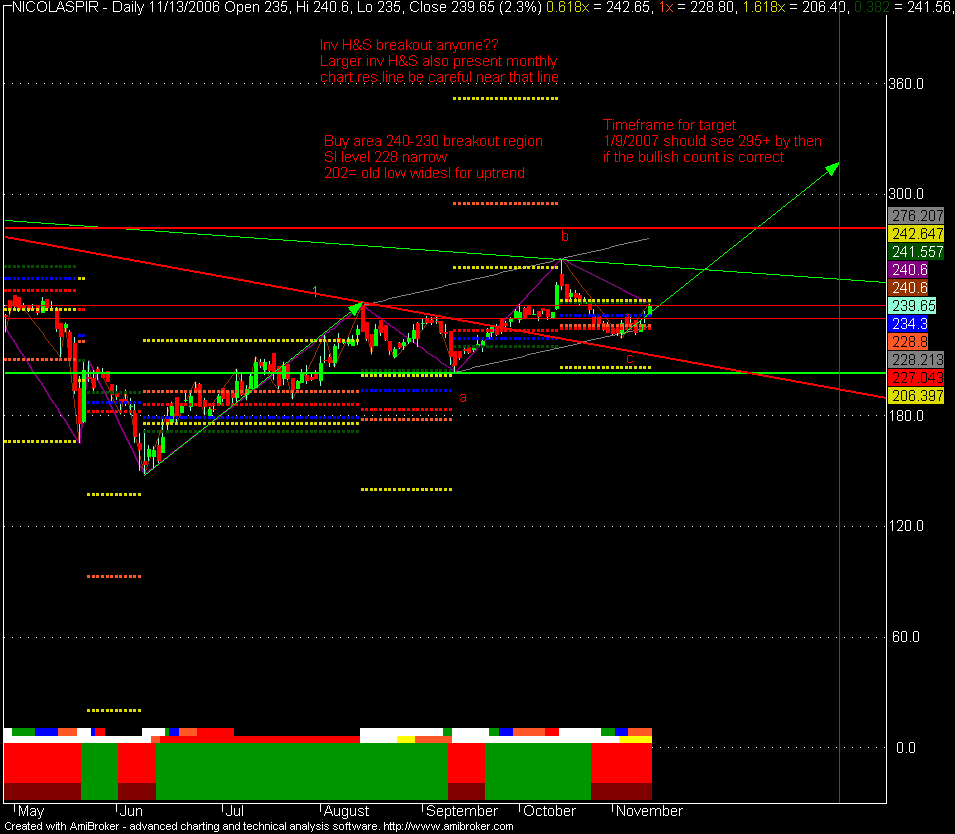
Nicolaspiramal flat correction, target 295+ by 1/9/2007

Image=Self Explanatory
Here is the summary
Breakout level supports 230/235/240
Narrow sl 228
wide sl for trend 202 (until bulls hold 200 my targets stay intact)
Targets 260/297/352
Interference from 256/268

Both traders and investors can use SIP entry = average entry over 3 days
in a bull move correction=2,3 days and rallies = 3-5 days
hence you are likely to emerge with a profit or worst case near break even after 5 days if u follow the systematic entry approach

Other entry techniques= buy pullbacks to 13/21 ema (hourly/daily/weekly)

Monthly chart trendline is what is stopping this chart from literally flying to the upside.

NICOLASPIR:9/29/2006
Close/cmp:236.6
Swing : Up=Buy ( 12.000% sensitivity)
Targets Active above:225.952
T1:260.221 T2:295.25
T3:351.921 T4:386.95
LastPivot203.55 TrailingStop:35.0294
0.618 sl:183.129