Refer to these sites for analysis
http://www.shareanalyst.com/newsletter.htm
http://www.indiainfoline.com/trade/strategy.html
http://niftytraders.blogspot.com/
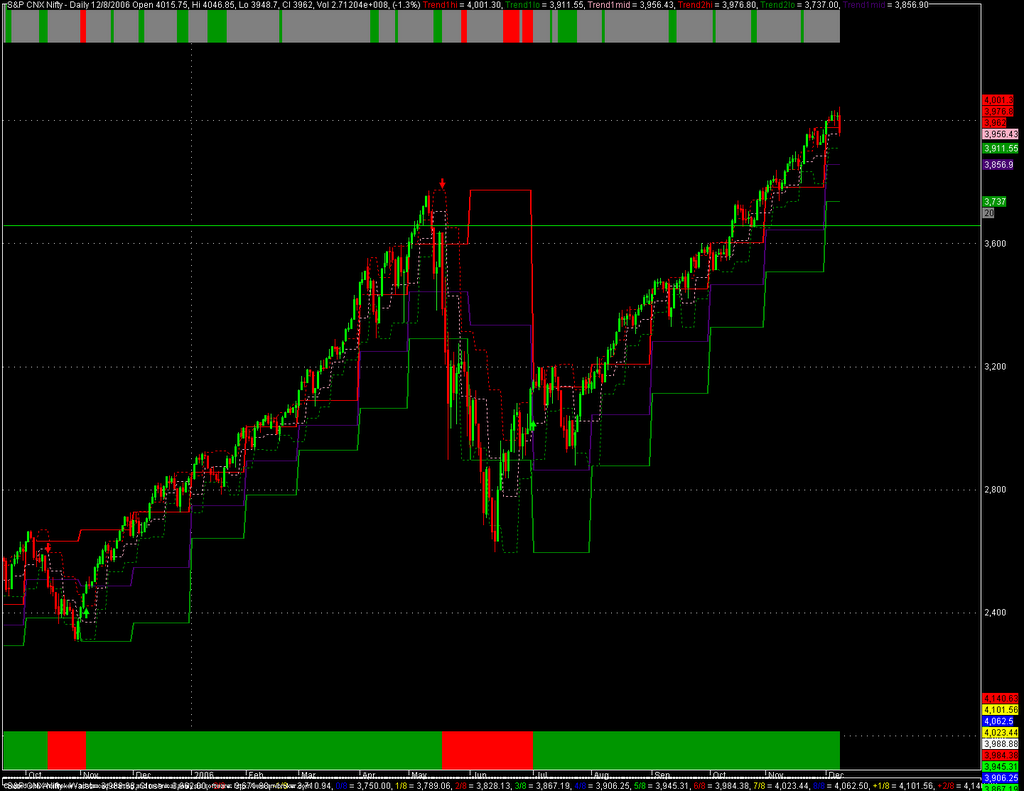
Strength above 3930 weakness below 3900
Sunday, December 31, 2006
Friday, December 22, 2006
New ideology
I haven't been trading much lately due to some problems with my internet connection and a lack of conviction in the direction of the markets.
The solution I have come up with is: no discussing/posting analysis until a position is taken.
Just like every other analyst out there. Take a position first then tell everyone else about it and ride your own wave up.
The solution I have come up with is: no discussing/posting analysis until a position is taken.
Just like every other analyst out there. Take a position first then tell everyone else about it and ride your own wave up.
Wednesday, December 13, 2006
Bullish scenario already explained earlier but keep bearish possibilities in mind

What if break above 3774 is a fake one??
No real way to know for sure but here is one thought for the fundamental investors
if cmp of nifty is 3774
and p.e is 20x (using rough figures here just bear with me please 10-20 pts and a few decimal pts 19.9 20.1 won't affect the outcome significantly :))
Current earnings = 3774/20 = 189
Next year's earnings using 15-22% growth = 217 - 230 (this comes from 6-10% gdp + 4% inflation so 15% is almost the bare min one would expect for nifty. The actual figure is likely to be much higher since nifty 50=best 50 companies of India and they can be expected to outperform gdp growth)
Now using savings rate of 7.25 % per year we get:
Earnings yield on savings deposit = 13.8
Nifty would be attractive if it was priced at a level such that it was priced at 13.8 times future expected earnings?
So the band we come up with is 217*13.8 - 230*13.8
= 2999.4-3174
Fits closely for a wave C down = A target of 2874 :)
or close enough anyway
P.S this just a one year discounting. I leave it as an exercise for savvy investors to use a longer term discounting model and come up with a suitable valuation. If looking over a horizon of 5-10 years then 15% cagr can really add up and give you huge returns in excess of a savings deposit even if current p.e were to be 30+.
Nifty w4 almost done completion of consolidation phase by 15th/25th of december likely!!
Nifty unfilled gap 3624-3656 giving support for now. The arithmetic channel was near 3700-3675 and its holding fairly well.
Log t2 is at 3630 and log channel is 3600. That would be 'fib perfection'.
The 'perfect' target for the drop. Remember t3 on upside and t2 on downside that is the rhythm of an impulse.
The market is not always perfect as evident from the action at 3975.
We briefly whipsawed and crossed over this key resistance. We did 4035 then humpty dumpty.
News analysts will say it was crr hike that killed us.
Trendline warriors will say trendline break below 3960.(note whipsaw of the trendline happened at 3866-3800 on 11/20/2006)
Swing traders will say 3860/3794/3774 stop levels were violated.
Funda analysts will say nifty hit p.e of 21.5 which was same as may 2006 top so in fundamental terms u have a DOUBLE TOP!!
P.s I mentioned all of these reasons in my analysis.
Who was right? The answer is everyone is right! Instead of imagining operators and gods who move the markets one would be a wiser if one were to study the principle of Emergence.
"Emergent structures can be observed in swarms and flocks. Flocking is a well-known behavior in many animal species from swarming locusts to fish and birds. Emergent structures are a favorite strategy found in many animal groups: colonies of ants, piles of termites, swarms of bees, flocks of birds, herds of mammals, shoals/schools of fish, and packs of wolves. A more detailed biological example is an ant colony. The queen does not give direct orders and does not tell the ants what to do. Instead, each ant reacts to stimuli in the form of chemical scent from larvae, other ants, intruders, food and build up of waste, and leaves behind a chemical trail, which, in turn, provides a stimulus to other ants. Here each ant is an autonomous unit that reacts depending only on its local environment and the genetically encoded rules for its variety of ant. Despite the lack of centralized decision making, ant colonies exhibit complex behavior and have even been able to demonstrate the ability to solve geometric problems. For example, colonies routinely find the maximum distance from all colony entrances to dispose of dead bodies.
"
--------Quote from site on emergence---------
If at first you don't see the connection between individual ants going about their tasks using chemical trails and trends in the stock market created by fiis+mfs+retail+hni+punters+rookie traders+veteran/floor traders then read a bit more carefully and use google to look around :)
Everyone who trades contributes to the market structure. If everyone has the same view (bullish/bearish) and trades on it then the market is likely to go in that direction. This is the basic foundation of trend following.
My Automated system stop level was 3860 narrow and 3774 wide posted earlier. Once 3860 broke it was retested for resistance and right now the same seems to be happening at 3774. My worst case drop anticipation is still 3630-3600 region (log t2/0.382 retrace of large swing + 0.618 retrace of small swing+log channel). I do not yet have a position in Nifty.
I would like one last drop to my key level so i can get an entry. No offense to all the bulls who are already long :)
I suggest hedging with 3850/3900 call options for december if already long to get some protection from downsides.
Market should consolidate for some time between 3600-3975 before heading for 4100-4450-5000 levels for next year.
The structure of the market would turn significantly bearish on a closing below 3600 at which pointt all bets are off (keep in mind 3975 whipsaw ) above 3600 safe, below 3600 ugly but i can't say there won't be a whipsaw :).
Log t2 is at 3630 and log channel is 3600. That would be 'fib perfection'.
The 'perfect' target for the drop. Remember t3 on upside and t2 on downside that is the rhythm of an impulse.
The market is not always perfect as evident from the action at 3975.
We briefly whipsawed and crossed over this key resistance. We did 4035 then humpty dumpty.
Who was right? The answer is everyone is right! Instead of imagining operators and gods who move the markets one would be a wiser if one were to study the principle of Emergence.
"Emergent structures can be observed in swarms and flocks. Flocking is a well-known behavior in many animal species from swarming locusts to fish and birds. Emergent structures are a favorite strategy found in many animal groups: colonies of ants, piles of termites, swarms of bees, flocks of birds, herds of mammals, shoals/schools of fish, and packs of wolves. A more detailed biological example is an ant colony. The queen does not give direct orders and does not tell the ants what to do. Instead, each ant reacts to stimuli in the form of chemical scent from larvae, other ants, intruders, food and build up of waste, and leaves behind a chemical trail, which, in turn, provides a stimulus to other ants. Here each ant is an autonomous unit that reacts depending only on its local environment and the genetically encoded rules for its variety of ant. Despite the lack of centralized decision making, ant colonies exhibit complex behavior and have even been able to demonstrate the ability to solve geometric problems. For example, colonies routinely find the maximum distance from all colony entrances to dispose of dead bodies.
"
--------Quote from site on emergence---------
If at first you don't see the connection between individual ants going about their tasks using chemical trails and trends in the stock market created by fiis+mfs+retail+hni+punters+rookie traders+veteran/floor traders then read a bit more carefully and use google to look around :)
Everyone who trades contributes to the market structure. If everyone has the same view (bullish/bearish) and trades on it then the market is likely to go in that direction. This is the basic foundation of trend following.
My Automated system stop level was 3860 narrow and 3774 wide posted earlier. Once 3860 broke it was retested for resistance and right now the same seems to be happening at 3774. My worst case drop anticipation is still 3630-3600 region (log t2/0.382 retrace of large swing + 0.618 retrace of small swing+log channel). I do not yet have a position in Nifty.
I would like one last drop to my key level so i can get an entry. No offense to all the bulls who are already long :)
I suggest hedging with 3850/3900 call options for december if already long to get some protection from downsides.
Market should consolidate for some time between 3600-3975 before heading for 4100-4450-5000 levels for next year.
The structure of the market would turn significantly bearish on a closing below 3600 at which pointt all bets are off (keep in mind 3975 whipsaw ) above 3600 safe, below 3600 ugly but i can't say there won't be a whipsaw :).
Good analogy for trading as a business
What separates the successful traders from the failed ones is the ability to see trading as a business.
"I'll never forget the saying of my second boss: Trading is a business like any other business. Learn to buy wholesale and sell retail. If they don't come for your inventory~ mark it down and move it out the door" (This is called taking a loss, by the way.)"
Linda Raschke, street smarts
A nice extension of this basic analogy has also been proposed by our very own Prem
"Prem's 10 simple tips like a shop
1)Trading in share mrkt is like opening a new shop.
2)Identify the product with good demand.
3)Buy the Products which has long shelf life(L&T,BHEL,BEL).
4)If there is a particular demand for the season like cements,textiles(Diwali &Holi season) buy&sell them in season.
5)Dont buy perishable items(penny stocks).
6)Maintain standards in shop for purchase & pricing.
7)As demand increases for ur product try to sell some qty at every rise(remember there is no MRP).
8)Do your homework on purchase and maintain good Accounts(essential for shop)
9)If there is a strike(correction),close your shop and stay at home, you can buy good products at a cheap price during the strike.
10)If u dont have enuf money buy it thru advance payments(F&O)....GUD LUCK FOR YOUR SHOP."
If you approach the market as a business you will succeed.
Here are my practical translations
Use sector Rs to figure out which sector is in demand
Use stock Rs to figure out which stock within the sector is most in demand
Buy stocks which meet a minimum quality in terms of traded volumes/trade capitalization per day
Fundamental Investing is about buying value or growth.
Trading is more about buying whats in demand :)
So my summary for now invest in sugar/cements/IT/capital goods/Auto parts/Pharma, trade in infra/realty.
Specific list of stocks which I consider worth trading in are listed in the previous post.
"I'll never forget the saying of my second boss: Trading is a business like any other business. Learn to buy wholesale and sell retail. If they don't come for your inventory~ mark it down and move it out the door" (This is called taking a loss, by the way.)"
Linda Raschke, street smarts
A nice extension of this basic analogy has also been proposed by our very own Prem
"Prem's 10 simple tips like a shop
If you approach the market as a business you will succeed.
Here are my practical translations
Fundamental Investing is about buying value or growth.
Trading is more about buying whats in demand :)
So my summary for now invest in sugar/cements/IT/capital goods/Auto parts/Pharma, trade in infra/realty.
Specific list of stocks which I consider worth trading in are listed in the previous post.
High Beta stocks

If one trades high beta stocks using the nifty as a timing tool then risk can be minimized and rewards maximized
This is my pet theory which i have verified using automated backtests
Traders will tell you buy strength and sell weakness. Well I have created systems which define strength and weakness and tell me which stocks to buy/sell
Just see this watchlist for an example
Nifty rose by 1% today. See the gain in these stocks
Monday, December 11, 2006
Nifty begins w4??

Possible w4?
Log Targets using 3200-287x as base swing
3784/3630/3378. Strongest support at 3630-3600 rising 10% channel area for w4
most probable retracement levels for w4
(0.236/0.382/0.5) 3764/3595/3408
Sunday, December 10, 2006


Nifty Swing Trading updated sl At 3856/3774 target 4100-4200
Purple line = stoploss level reads 3857
Cycle degree breakout intact till 3774 is held sl for cycle degree swing is last pivot at 8800 sensex which will probably never get broken unless we have WWIII or something. Targets are monstrous 20-36k sensex and 6-12k nifty
Wednesday, December 06, 2006
Intraday Data
If you are interested in intraday data (Power Indiabulls - > Amibroker) then go to http://niftytraders.dyndns.org:8080
Delay when reading PIB -> Amibroker is 0.005 seconds. However the real delay comes from the delayed write functionality of PIB which takes 30 seconds-1min before it writes live data to the hdd.
So net mean delay would be around 45 seconds. Keep in mind there are services charging 3000 Rs a month for 5 min delayed data so this is not a bad deal at all!
Cost is 5000 Rs for one year or you can lease for 500 Rs per month.
Contact me on yahoo: rajak1981@yahoo.com if you would like to make a purchase.
If you have another terminal like PIB and need a plugin for a your data source then you can also drop me a line.
You will need to show me the format of the data source and I can code the plugin for you (Cost will remain 5000Rs)
P.S : My niftytraders sites will be down for a day or 2 because my comp has a nasty sdbot worm. In the process of cleaning it up
Sunday, December 03, 2006
REL follow the trend
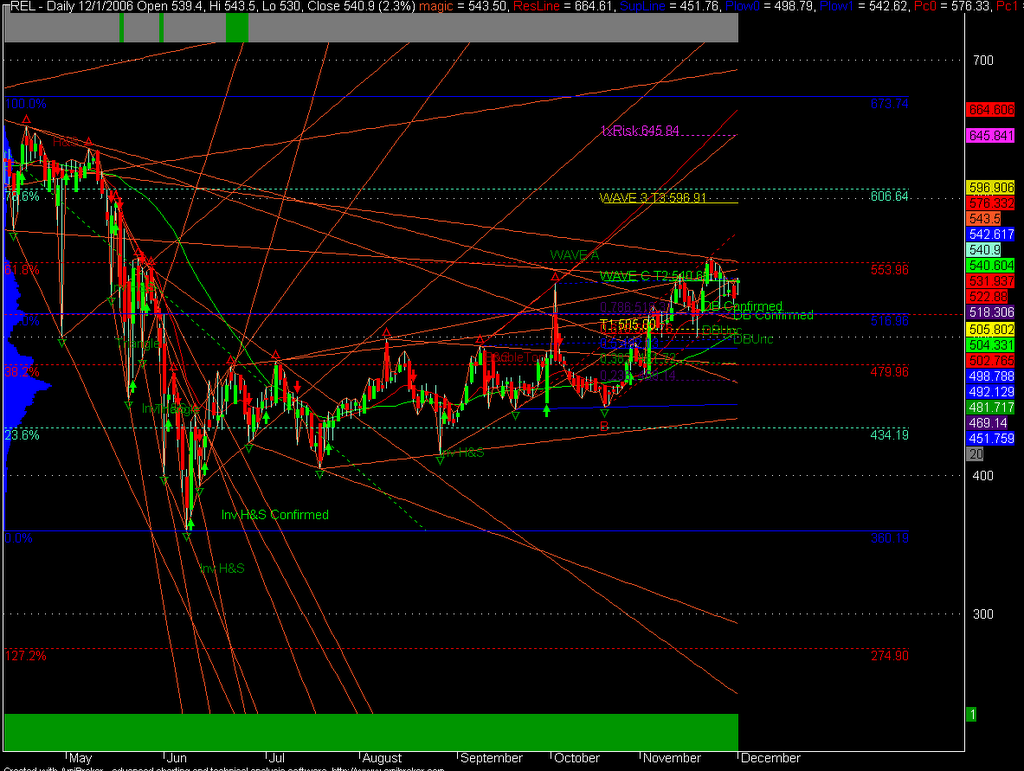
New Trading framework which i call the trendline warrior.
Just need to figure out which trend to follow :))
careful around 556 could kill the move.
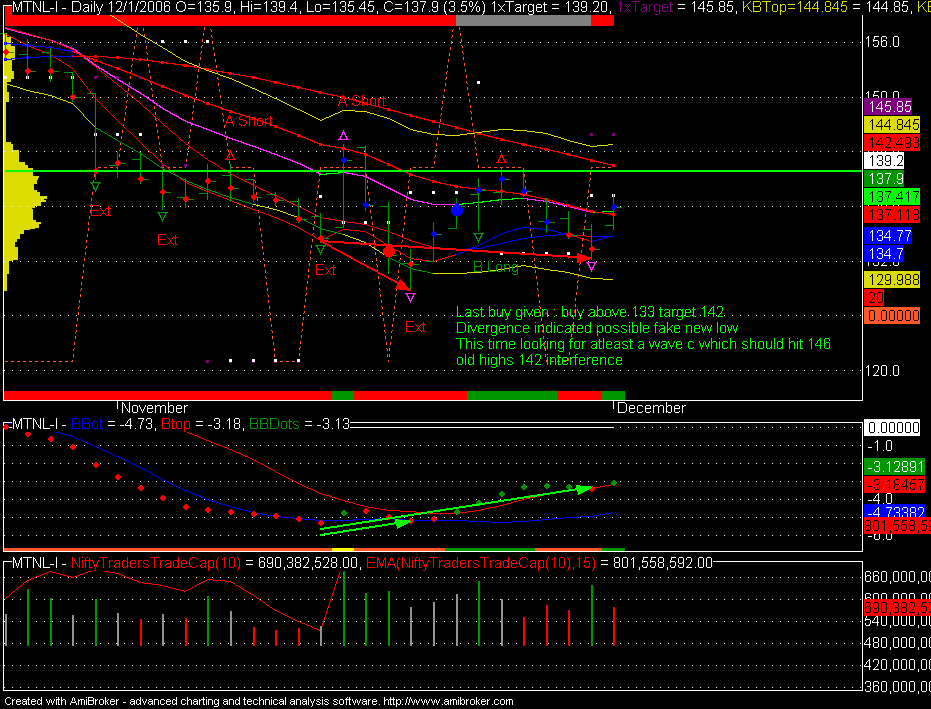
Mtnl inv H&S? forming? or w4 triangle?

Could go either way
Trade the trendline?
or your favorite moving average ex 13/21 ema
Bullish divergence possibly forming a very long term bottom
BEL Concrete study ABC setup now moving
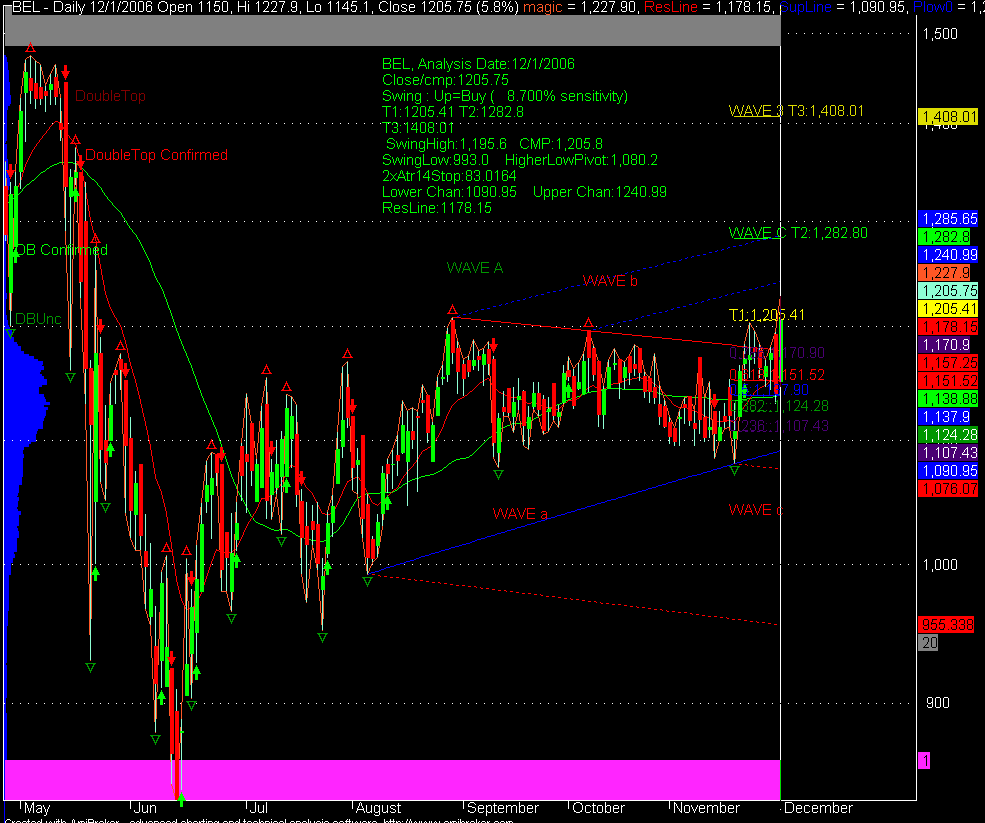
Bel was sugggested as a buy from 1100-1200
and then as a breakout trade with 1200 calls above 1200 for a target of 1400.
Here is the picture for the setup
Min target to me seems to be 1241 within 2-3 days, 1282 within 2-3 weeks and 1408 within 2-3 months.
My favored target is 1400
I Do not have a long position in BEL yet.
Sunday, November 26, 2006
Trading the ABC Setup

The basic idea is to separate trend movements from counter trend movements.
A cwave is a fake higher high or lower low which results in a trap.
Step1:Watch your macd
Step2:Watch your moving averages
IF these 2 are saying down then that new high you just saw might be a fake one :)
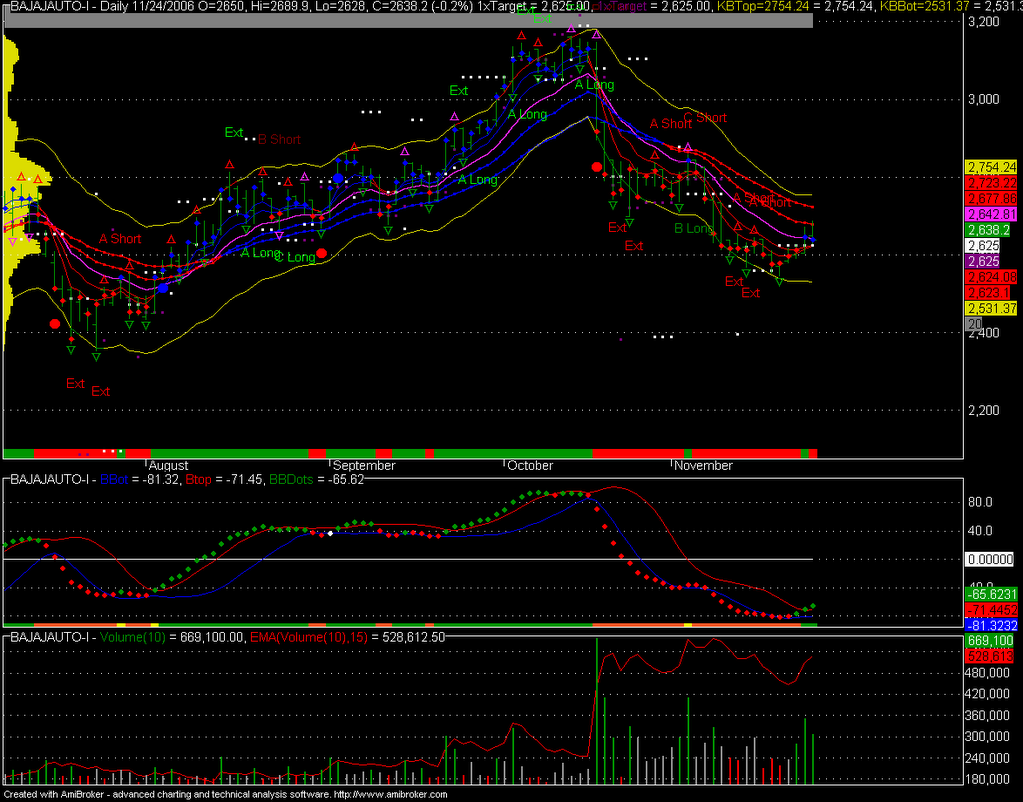
Recent examples can be found in glaxo/bajajauto.
Original post by me a long long time ago
Finally finished coding the afl for the abc detector
One interesting finding was that the market rarely gives abc setups on the daily charts.
Instead its mostly A down and then up.
Intraday the abc division might be present.
If however you do see an abc setup you should look to play it because the risk/reward ratio is quite favorable.
P.S nifty formed a low at the 9ema this time
shallow correction. Expected correction depth was 3900-3857.
Thursday, November 23, 2006
NIfty Arithmetic t3 non event at 3857 now watch log t3 at 3978
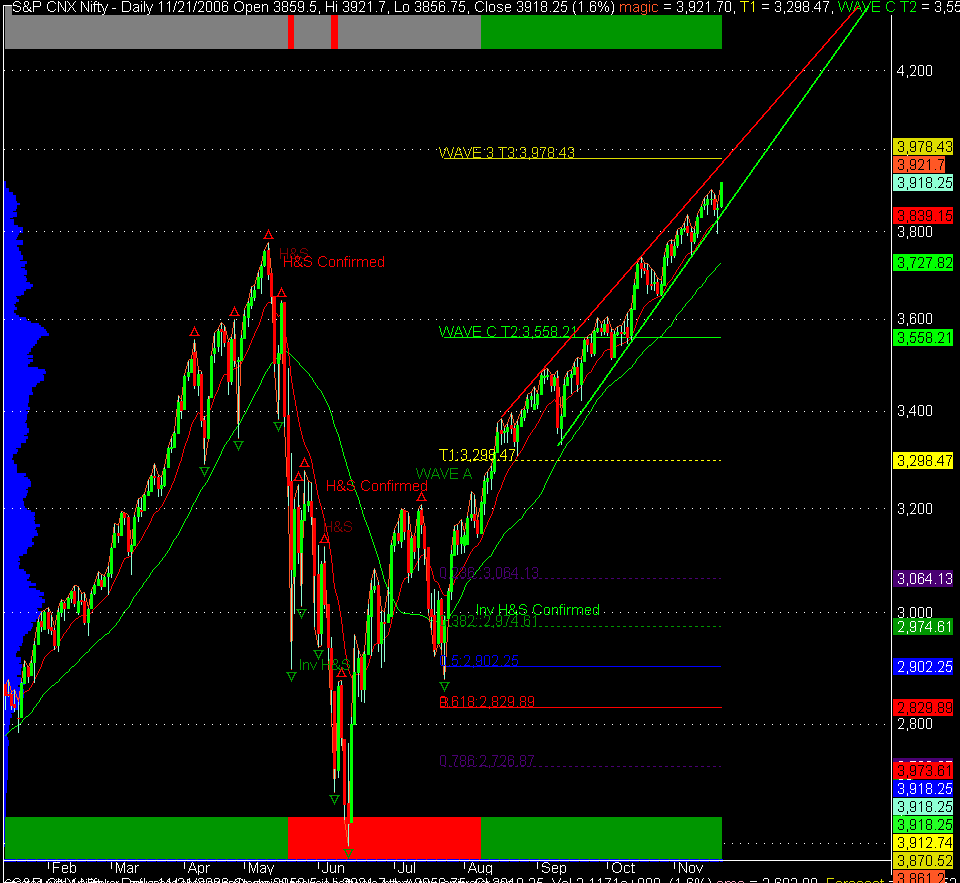

We just keep breaking levels to the upside. 3857 gave us a correction in some stocks a big one too (ex. maruti 967 corresponding level it fell 10%, ivrclinfra 367-320)
After the correction the supports held.
All supports holding so far (support for last dropped was marked as 3774, indiv stocks gave a clear signal to buy near their old tops formed a few weeks ago, ex ivrclinfra 320, abb 3330 satyam 412, sail 80-84) the depth of correction varied some stocks did very deep 10% corrections ex. sail. Nifty itself was stronger than the indiv stocks and bounced from 3789 itself.
Two more pictures
Log t3 at 3978 (I rounded off to 3975 earlier on yahoo i think)
Anyway pt being , 5-8-10% correction is overdue
One such correction comes every 8 months or so
Above 4000, 4128/4200 region
Below 4000, 3650 support region
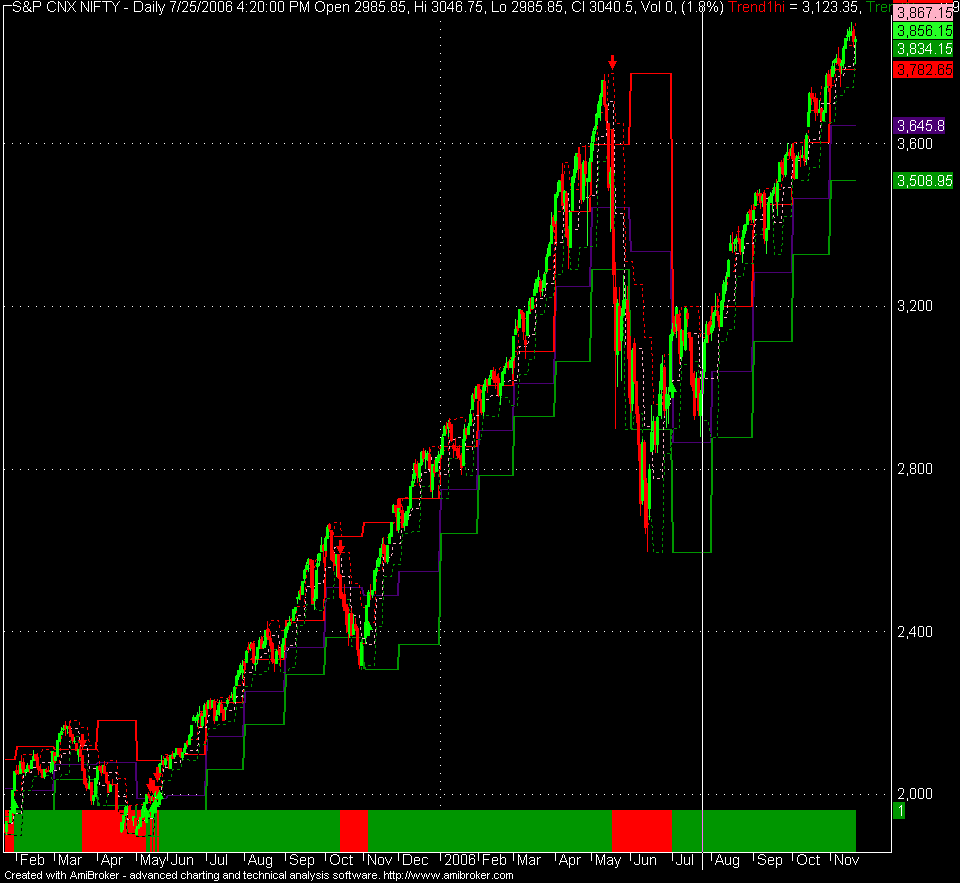
Wednesday, November 22, 2006
Brute force pivots/fibonacci vs neely/ewt finesse
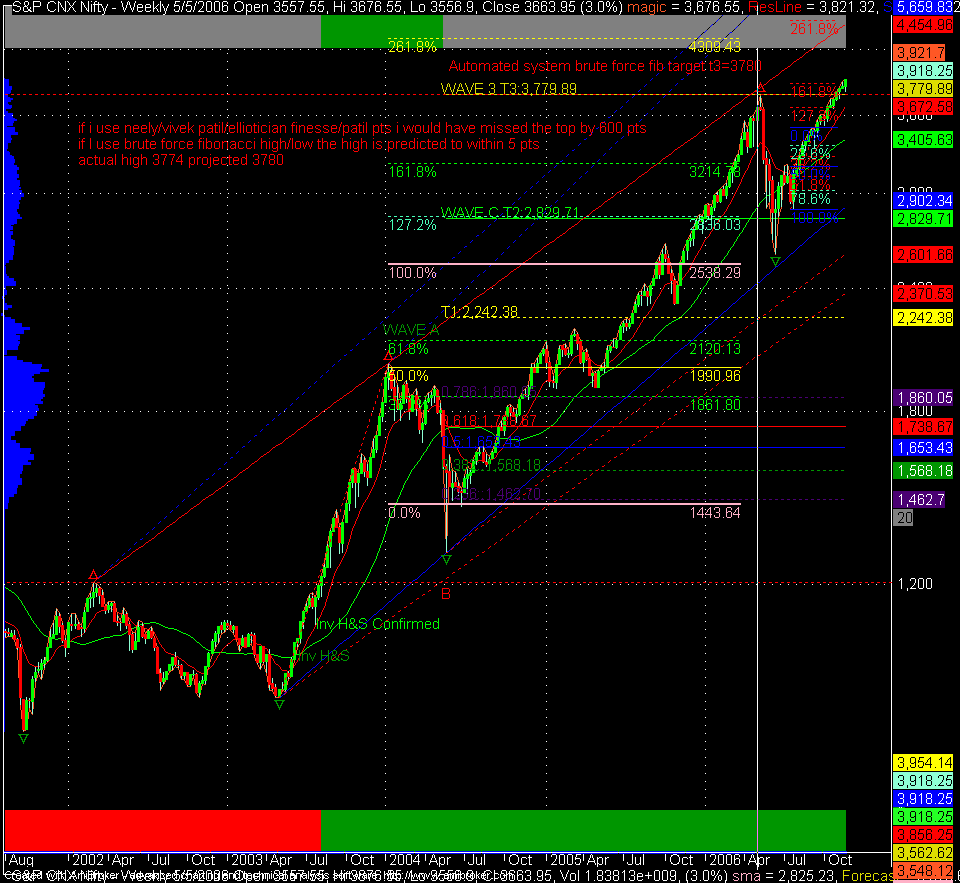
Which works better??
Decide for yourself
If someone could have projected the prev wave high of nifty better than 3780 then maybe we have something
S&P CNX Nifty, Analysis Date:5/5/2006
Close/cmp:3663.95
Swing : Up=Buy ( 21.000% sensitivity)
T1:2242.38 T2:2829.71
T3:3779.89
SwingHigh:2,014.7 CMP:3,663.9
But if not then brute force projection will remain king :)
I remember quite clearly that a lot of patil and ewt followers told me in 2005 that that brute force wouldn't work because the wave started somewhere else and did not terminate at the lows but a little bit higher at some other random 'subjective point'
The 'objective' termination pt is the lowest pt which is able to contain the followup waves in a channel.
Siemens Impulse
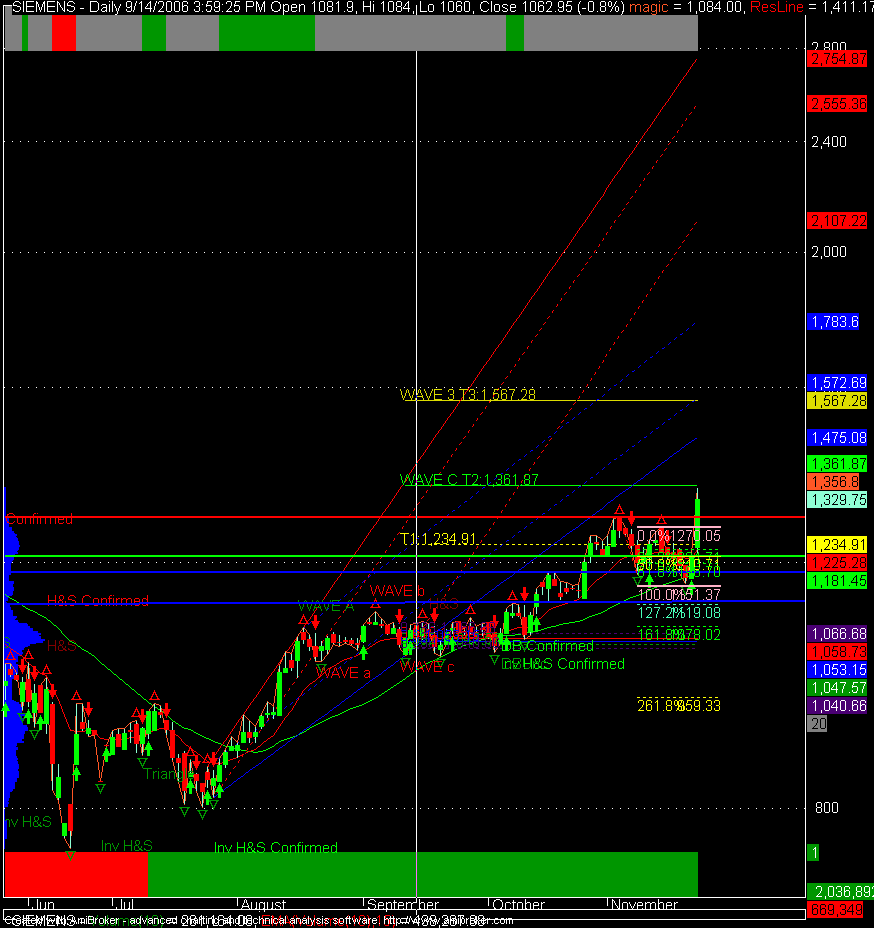
Siemens entry advised near 1156 (abc setup+siemens ag was up) then btst 1202 (day high break). See insiders always know :).
Siemens ag was up 2 days ago for a reason.
Intraday some crazy news came Rs 40 billion order and siemens went impulsive doing the upper channel target of 1352.
if 1362 can be sustained (wider t2) then 1416 and 1576 are valid.
Confluence resistance seems to be in 1567 region for a dual t3. look to short there whenever siemens get there. until then look to follow this trend rather than fade it.
Breakout level is 1292 can get retested if 1362 holds.

Monday, November 20, 2006
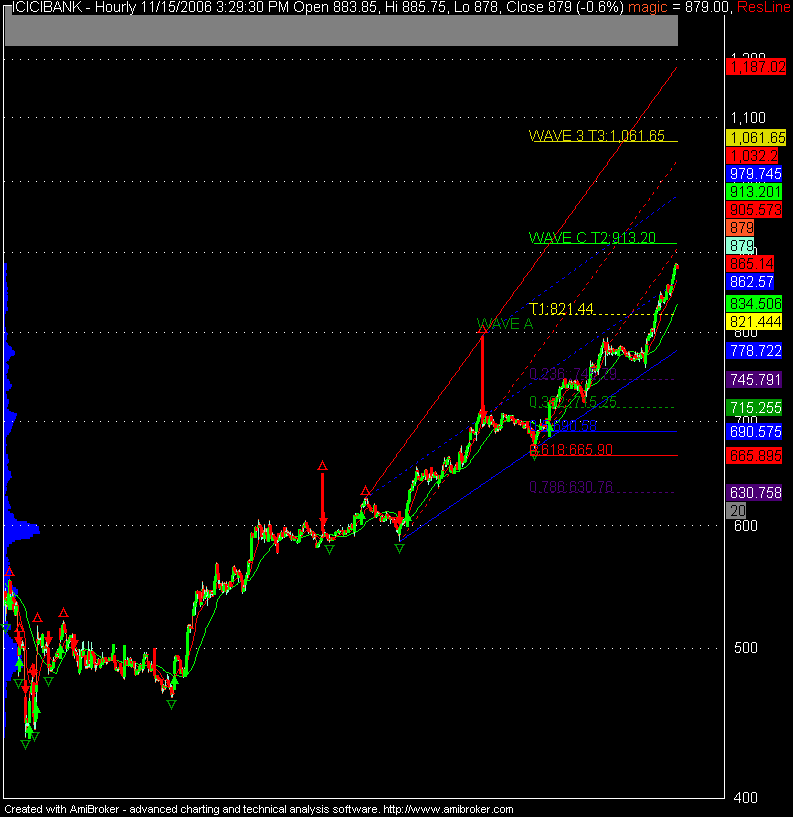
Nifty Swing Target Updated to 4100 , sl updated to 3645
This is no longer Gann swing. This is my own tripple trend trading system.
The stoploss is the thick indigo colored line.
It currently reads 3645
Target is updated to 4100
I am now working on my own systems since I've studied the works of most of the well known traders.
Gann, Larry Williams, Alexander Elder, Bill Williams, Cooper, Raschke, Tony Crabel, Elliott.
I figure its time to get Raja added to the list of famous system developers :)
Jphydro does wolf wave target
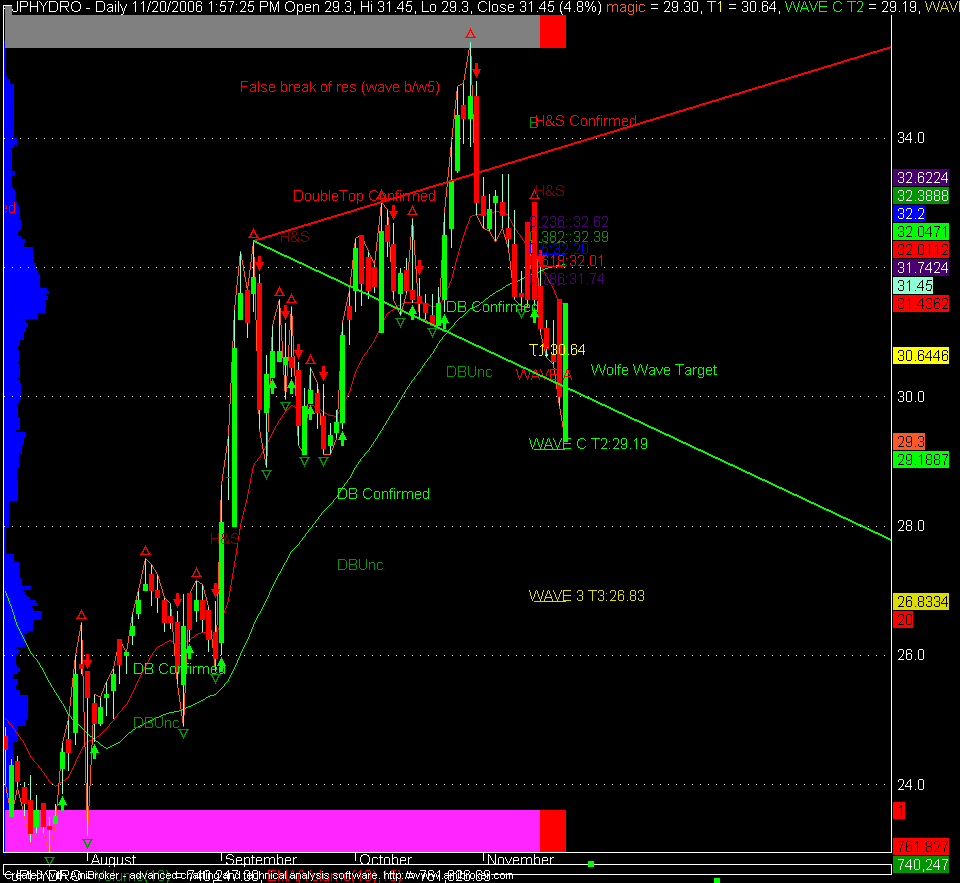
An interesting pattern
This is just the post mortem of the short trade on whipsaw under res line.
Target is computed using a strange combo of pivots
Google for wolfe wave for details
Saturday, November 18, 2006
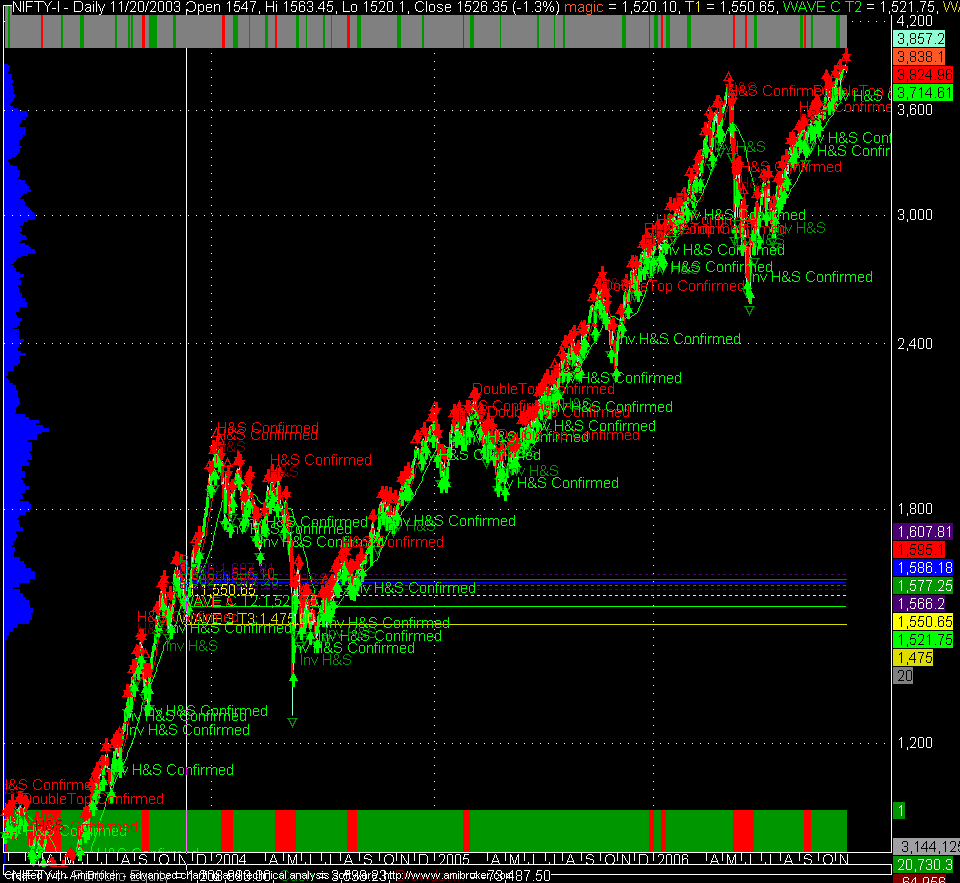
India's First!? Computerized Pattern recognition system
Here is my latest work. I'm fairly sure no one else has gone down this route yet in India anyway. For ms and Amibroker you can already purchase pattern recognition systems on the web (U.s/European vendors)
I find that making a loss in the market is great motivation to try out something new and make something better. (I recently had a loss in chennpetro :))
Most people have ridiculed my mechanical approach at one point of time or another. When it comes to Trading system development/testing I have actually recieved more help/encouragement from my few friends in Europe than the many (online) friends in India.
I guess us Indians are more emotional than logical. Acting on cold hard facts and patterns would not be our forte. We would put in the emotional gut feel trading style in it anyway :). I have a mixed upbringing, partially western and partially desi in my values hence I seek the middle ground. A mechanical system is fine for guidance but it should be designed in such a way that it can be followed without major emotional excesses (ex. a system which has a drawdown >10-20% is not very easy to follow :))
For now my first step will be to just use this scanner as an advisor for interesting trades which could be taken. I am keen to collaborate with a fundamental analyst who can quickly give me a summary of the fundamental trend for a stock so that we can decide on whether to trade the chart pattern or not.
Keep in mind this is only a chart pattern recognition system. It is not a complete trading system yet since it does not incorporate risk management. That will be my next project.
Maybe after I make my next big loss. Perhaps I should work on the risk management part right now to avoid the next big loss :).

Backtest results
Backtest is done on nifty-I
results are 528% long+short
during the same period buy and hold = 1400-3900 = 274%
i sense a winner here :)
Keep in mind 528% is long+short with 1x leverage if u have more risk appetite u can pyramid and do all kinds of other stuff.
If you have ideas for a chart pattern recognition system do buzz me on yahoo:rajak1981@yahoo.com. I'm always looking to improve/add new features.
Nothing will ever beat the human eye when it comes to recognizing patterns. This system is likely to miss out some signals. On the other hand the main problem with 'eyeing a chart' is that you might not be able to backtest your strategy as rigorously as a well defined mathematical system.
I find that making a loss in the market is great motivation to try out something new and make something better. (I recently had a loss in chennpetro :))
Most people have ridiculed my mechanical approach at one point of time or another. When it comes to Trading system development/testing I have actually recieved more help/encouragement from my few friends in Europe than the many (online) friends in India.
I guess us Indians are more emotional than logical. Acting on cold hard facts and patterns would not be our forte. We would put in the emotional gut feel trading style in it anyway :). I have a mixed upbringing, partially western and partially desi in my values hence I seek the middle ground. A mechanical system is fine for guidance but it should be designed in such a way that it can be followed without major emotional excesses (ex. a system which has a drawdown >10-20% is not very easy to follow :))
For now my first step will be to just use this scanner as an advisor for interesting trades which could be taken. I am keen to collaborate with a fundamental analyst who can quickly give me a summary of the fundamental trend for a stock so that we can decide on whether to trade the chart pattern or not.
Keep in mind this is only a chart pattern recognition system. It is not a complete trading system yet since it does not incorporate risk management. That will be my next project.
Maybe after I make my next big loss. Perhaps I should work on the risk management part right now to avoid the next big loss :).
Backtest results
Backtest is done on nifty-I
results are 528% long+short
during the same period buy and hold = 1400-3900 = 274%
i sense a winner here :)
Keep in mind 528% is long+short with 1x leverage if u have more risk appetite u can pyramid and do all kinds of other stuff.
If you have ideas for a chart pattern recognition system do buzz me on yahoo:rajak1981@yahoo.com. I'm always looking to improve/add new features.
Nothing will ever beat the human eye when it comes to recognizing patterns. This system is likely to miss out some signals. On the other hand the main problem with 'eyeing a chart' is that you might not be able to backtest your strategy as rigorously as a well defined mathematical system.
Thursday, November 16, 2006
Gann Fan Madness

I have no clue how gann fans work.
If someone has an insight into fans + gann squares do buzz me on yahoo: rajak1981@yahoo.com
Experimental Afl
Brute force lots of fans being drawn from lots of pivots :)
Gann used to live in the age of few pts up + few pts down.
It was his assertion that his gann square going till 1000 or so would be plenty :D.
We're in the age of stocks going beyond 1000,2000,3000
So i am debating making a logarithmic adaptation of the basic gann fan.
The idea is to make the gann fan line move up a fixed % per day instead of a fixed # of pts.


Wednesday, November 15, 2006

Sensex longer term target of 20-36k just opened for investors
Sensex targets for investors???
Follow the log channel
sl below channel or last pivot??
targets active until last pivot is broken to the downside thats 8800 :)
obviously too far away :)
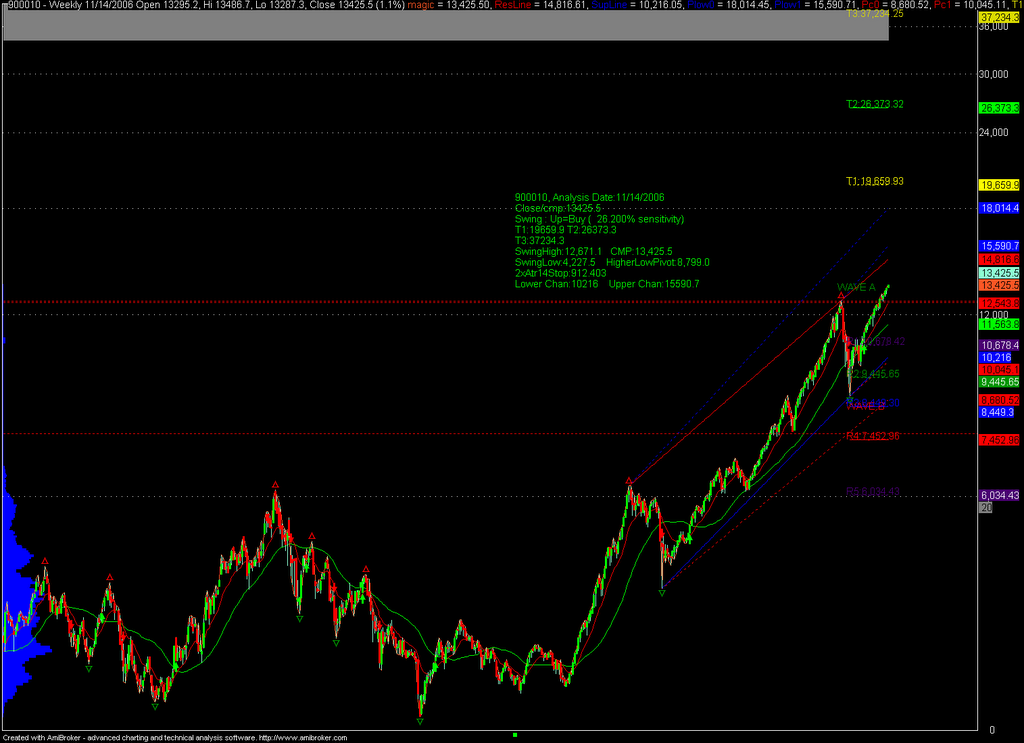
Tuesday, November 14, 2006
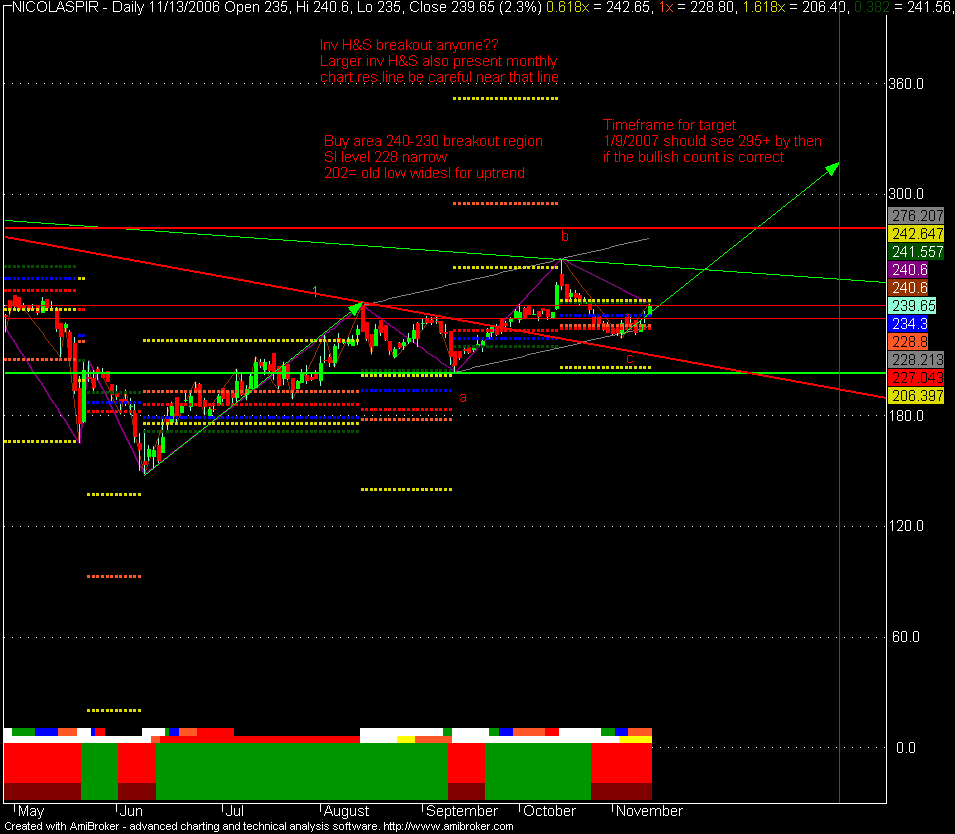
Nicolaspiramal flat correction, target 295+ by 1/9/2007
Image=Self Explanatory
Here is the summary
Breakout level supports 230/235/240
Narrow sl 228
wide sl for trend 202 (until bulls hold 200 my targets stay intact)
Targets 260/297/352
Interference from 256/268
Both traders and investors can use SIP entry = average entry over 3 days
in a bull move correction=2,3 days and rallies = 3-5 days
hence you are likely to emerge with a profit or worst case near break even after 5 days if u follow the systematic entry approach
Other entry techniques= buy pullbacks to 13/21 ema (hourly/daily/weekly)
Monthly chart trendline is what is stopping this chart from literally flying to the upside.
NICOLASPIR:9/29/2006
Close/cmp:236.6
Swing : Up=Buy ( 12.000% sensitivity)
Targets Active above:225.952
T1:260.221 T2:295.25
T3:351.921 T4:386.95
LastPivot203.55 TrailingStop:35.0294
0.618 sl:183.129
Thursday, November 09, 2006
Tisco buy above 502/507/512, target 539/565/625 sl 500/492/485
Simple patterns/channels
Probably lots of reasons to be bullish on tisco as long as 485 holds
Funda report by merryl
, investment rating C-2 (0-20% return over next 12 months given at a price of 515 when the acquisition of corus was announced), tisco proceeded to drop to lower channel after the news


Tisco bouncing from lower channel (you could call it a flat or a triangle with a false break of trendline in e leg whatever u wanna call it , it looks bullish to me :))
Setup is very similar to rel at 450
just needs to hold 485 for a significant upmove
Confirmation is above recent high 512 and broken trendline 507
(507 is also results day high so a break above it would indicate a lot more upside)
Probably lots of reasons to be bullish on tisco as long as 485 holds
Funda report by merryl
, investment rating C-2 (0-20% return over next 12 months given at a price of 515 when the acquisition of corus was announced), tisco proceeded to drop to lower channel after the news
Tisco bouncing from lower channel (you could call it a flat or a triangle with a false break of trendline in e leg whatever u wanna call it , it looks bullish to me :))
Setup is very similar to rel at 450
just needs to hold 485 for a significant upmove
Confirmation is above recent high 512 and broken trendline 507
(507 is also results day high so a break above it would indicate a lot more upside)
Tuesday, November 07, 2006
Buy Prithvi CMP 360, target 440 by april 07
No stoplosses for investments:
Raja Kumar: Prithvi: investment buy for t2/t3
405/468 by april 07
no stoplosses only targets for investments
sell if fundas turn sour.
http://0301.netclime.net/1_5/2/O/U/Prithvi%20Information%20.pdf
my view: all investments should be backed by fundas
anyone who sends an invesment call would do well to also send a detailed funda report alongside the investment call . this will help to get an idea of valuations with respect to peers/growth potential etc
PRITHVI:9/21/2006
Close/cmp:322.55
Swing : Up=Buy ( 12.000% sensitivity)
Targets Active above:331.664
T1:365.654 T2:405
T3:468.654 T4:508
LastPivot302 TrailingStop:39.346
0.618 sl:286.346
Lower:302.607 Upper:0
Risk/Reward T1=2.09752
Risk/Reward T2=4.01217
Risk/Reward T3=7.10969
Relpetro fresh move possible
RPL Trade summary:
Buy 66, sl 63, target 68.55/70/72
Summary: buy over 3 days, sip for traders
66/65/64 entry area
sell after 5 days
do not risk > 5% of capital wide sl is 63 use that level to compute acceptable risk
Raja Kumar: as long as rpl doesn't have to subsidize as per govt policy this could be gr8 news. If govt continues heavy subsidies and oil prices remain high then this venture could go sour.
udayabhaskars (11/6/2006 10:34:13 PM): RPL has plans to set up 504 retail outlets (ROs) across the country, including in remote and low service areas, within the next three years....... This clearly indicates RPL's balance sheet with profits will roll from 2007-08 by marketing the RIL products........ cheers...
Raja Kumar: rpl has given a gap up
if gap is not fully closed out within 2-3 days it will make a massive move
for other examples of this phenomenon (news+gap up + no fill) plz see ifci/dr.reddy which were picked recently
ifci 10.7 and reddy at 750
rpl lets say that half the gap can get filled that would be rough entry area, sl below rim of gap or last low
can trade in delivery
Raja Kumar: rpl entry 66/65/64
sl narrow 64(intrada) wide 63 (wide=trend sl)
Flirterboyca g: tell me best level 2 buy rpl
Flirterboyca g: not fro trading
Flirterboyca g: for FD purpose
Raja Kumar: buy at closing
Raja Kumar: next 3 days
Raja Kumar: average
Raja Kumar: u will not have a loss
Raja Kumar: in 5 days
Raja Kumar: because in a bull market
Raja Kumar: corrections run 2-3 days
Raja Kumar: and rallies run 3-5
Raja Kumar: and rpl looks ripe for a new bull move
Flirterboyca g:
Raja Kumar: sip for traders
Importance of booking profits
Taurian: counter-view: by booking profits, we may be throwing the baby out with water.....applies only to investments of course...
Raja Kumar: yes
Raja Kumar: have u read reminiscences of a stock operator?
Raja Kumar: if u sell your long position u have no position
Raja Kumar: in a bull market
Raja Kumar: buttttt
Raja Kumar: here's how it works imho
Raja Kumar: sell excess leverage longs
Raja Kumar: or trim them
Raja Kumar: a bit
Raja Kumar: this puts people in the right frame of mind
Raja Kumar: when u have booked 30-50% of your profit
Raja Kumar: on a trade
Raja Kumar: then u will be willing to move sl to break even or a small loss on remaining
Raja Kumar: and let the market do what it wants
Raja Kumar: but if u are holding full position
Raja Kumar: then u will behave like a manic depressive
Raja Kumar: extremely happy as market swings up
Raja Kumar: and sad as it swings down
Raja Kumar: because emotions are relative
Raja Kumar: to your position
Raja Kumar: if u have sold half then if market tanks
Raja Kumar: u will be 50% happy
Raja Kumar: that its down
Raja Kumar: and 50% sad
Raja Kumar: that u didn't book other half
P.s : By book profits i usually mean book near t2/t3 in a bull market and not at t1 or random points :)
t2=1x target, t3=1.618 target
Monday, October 30, 2006
Nifty profit booking zone 3800-3870

What is the difference between a trader and an investor??
Investor buys and holds. Trader tries to enter/exit :)
Investors are super cycle degree traders. Intermediate degree traders will now be looking for some exits.
There are tons of technical/positional/swing traders out there who are following this particular analysis. Lots of positional traders who bought nifty near 3000-3200 want an exit near 3800 region.
Even if 3804-3857 is crossed a corrective dip of atleast 10% is on the cards.
Once the correction is out of the way then we will target 4100 which is my cycle degree channel and first reasonable target for wV of some degree.
it is still debatable whether we are in a corrective wave c rise (wave B of a flat or some other corrective pattern post the bottom at 2595). The beauty of fibonacci analysis is that t3 is overbought no matter how u look at it.
IF rise is w3 then dip of 10% and rally of another 20% possible.
If rise is wc of wave B then dip of >10% and rising channel would break.
Expectation was for 3800 by jan07. We seem to have gotten there a bit early. Choppy+sideways. First hint i am right would be tech breaking supports. Tech is the leader of this bull market not reliance as many bulls would like to think.
How much in % has reliance given to investors over the past 2 decades and how much has tech given?
Keep close tabs on cnx it in the coming sessions.
Thursday, October 26, 2006
Momentum Pinball
Will post details later.
Try to trade long side if market is above early morning lows
Otherwise try the short side.
Latest scans
The original book is here
Try to trade long side if market is above early morning lows
Otherwise try the short side.
Latest scans
The original book is here
Sunday, September 24, 2006
Nifty Uptrend update breakout above 3491
Nifty is in breakout mode.
Watch if 3491 can be sustained.
Next major target = 3870 above 3491
On the way up we have 3560/(3597.5/3600)/3640/(3707/3718/3721)/3774/3800/3870
In case of a drop we have supports at 3525/3515/3491/3430/3420/3384/3330
Stoploss for bullish swing traders at 3330.
Stoploss for shorts at 3560. Max short term downside expected is 3525/3491.
Above 3560 we should do 3600 straight.
Monday, September 11, 2006
Swing Trading: Nifty analysis Old swing low at 3300
Stoploss for positional long traders using the swing trading technique is 3300 nifty on a daily closing basis.
Sunday, September 10, 2006
Alok industries w3/inv H&S active above 70 and 66.7 supports 64 trendline stop 59

Alok industries setting up for a possible w3.
Target zone for inv H&S 80 rs.
If wc then alok would stall at 70. w3 likely if 70 is broken.
The breakout should be fast and furious hence safest way to trade this setup is a 70 rs call
T2 for wc is 69.8 upper channel at 69.6. Day high on 9/8/2006 = 69.xx
For w3 T3 is 77 rs which would be the first most reasonable target.
Alok calls can be bought for up to 2-3 rs.
521070:9/8/2006
Close/cmp:67.6
Swing : Up=Buy ( 13.000% sensitivity)
Breakout area: 58.5396
Targets Active above:62.8401
T1:64.9104 T2:69.8
T3:77.7104 T4:82.6
LastPivot57 TrailingStop:4.8896
0.618 sl:58.5396
Lower:59.1775 Upper:69.6325
Risk/Reward T1=-0.253736
Risk/Reward T2=0.207547
Risk/Reward T3=0.953811
Fib retracement levels which may function as support/res
Retracements :99.2-53.65
0.236:64.3998 0.382:71.0501
0.5 :76.425 0.618:81.7999
0.786:89.4523
64 has been crossed and should now function as support.
Next 2 targets in fib retracements are 71 and 76
82 calls can be sold to hedge longs once longs move into profits since that is the 0.618 retracement of the entire drop.
Strategy
a) Buy in a dip to 64/65. Stoploss for the trend is below trendline near 59/old lows 57
Intraday traders would have to improvise on stops hourly lows/daily lows will do.
b) Buy 70 call option (this would be my preferred strategy)
Monday, September 04, 2006
Dabur Cycle degree triangle Above 148/150 Targets 180+

Dabur cycle degree triangular consolidation
148-150 is the resistance zone
The support trendline is near 142 or so. Apex of triangle is due in another month.
Should form a healthy bottom buy October. Traders will be interested in the breakout above 148-150 resistance zone
Targets should be in the 180 region.
Retracements :173.8-107.1
0.236:122.841 0.382:132.579
0.5 :140.45 0.618:148.321
0.786:159.526
Colgate above 376 will do 412 sl 370/360

Colgate inv H&S/Triangle. Can't say whether its more of a descending triangle or an inv H&S. Take your pick. Watch the trendline.
Above 376 target is 412.
Sl is 370 once 376 is crossed
Fib levels are
Retracements :476.3-284.2
0.236:329.536 0.382:357.582
0.5 :380.25 0.618:402.918
0.786:435.191
Sunday, September 03, 2006
Strides Acrolabs 311/324/350 above 297/277/250

Stirdes Acrolabs
Some good news cooking.
check prem's blog
Fibonacci projections. most likely target T3 , looks like a 1-2, 1-2 setup
basically its bottomed on cycle degree. min reasonable target = upper channel/t2
325/329.8
STAR:9/1/2006 3:54:59 PM
Close/cmp:292
Swing : Up=Buy ( 9.200% sensitivity)
Breakout area: 272.78
Targets Active above:294.557
T1:307.72 T2:329.8
T3:365.52 T4:387.6
LastPivot272 TrailingStop:22.0796
0.618 sl:272.78
Lower:282.65 Upper:325.948
Risk/Reward T1=0.78602
Risk/Reward T2=1.89
Risk/Reward T3=3.67602
Mtnl To head towards 167 and 178

Mtnl may head towards 167 and 178 if it can hold 152/149
157 is the old high above which mtnl should show strength
Original fib, buy call was given near 150 region
Fib targets for current move are as follows
MTNL:9/1/2006
Close/cmp:155.85
Swing : Up=Buy ( 5.500% sensitivity)
Breakout area: 145.544
Targets Active above:154.427
T1:161.256 T2:168.8
T3:181.006 T4:188.55
LastPivot149.05 TrailingStop:7.5445
0.618 sl:145.544
Lower:153.194 Upper:163.275
A double bottom formation would be complete above 167 the target for which is 200
For now follow the trend.
154/153/152 supports from rising trend channel.
Upward targets intact as long as 149 is held but the upmove would lose some momentum below 153.
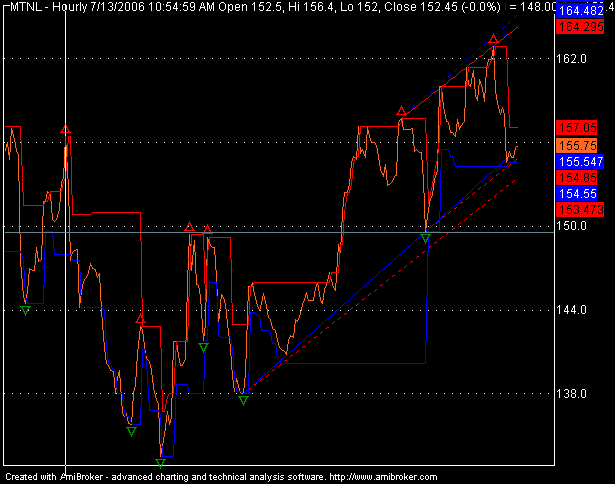
Once you have entered use a 2 day trailing low as a stop.
Key support 149
Key resistance 167
Above 157, 167
Below 154, 152/149
Below 149 uptrend in trouble.
Above 167 typical double bottom with lower volumes on second bottom
Target 200 within 2 months
Thats a 20% upside (167-200) with a 10% (167-149) risk
Swing traders may enter on new eod high just above 157.25 which also happens to be an old resistance level.
13ema is at 154.91, 21 ema is at 152.894
mtnl is barely recovering above and currently retesting 200 ema
153.56.
Remember bulls live above 200 ema and bears below :)
Subscribe to:
Comments (Atom)