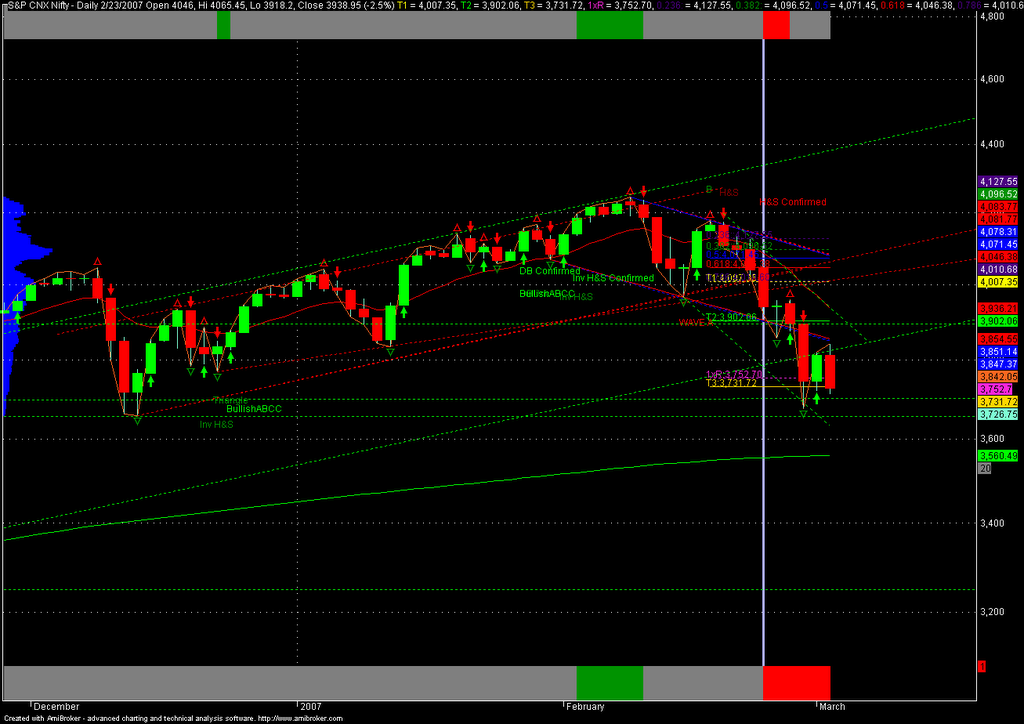
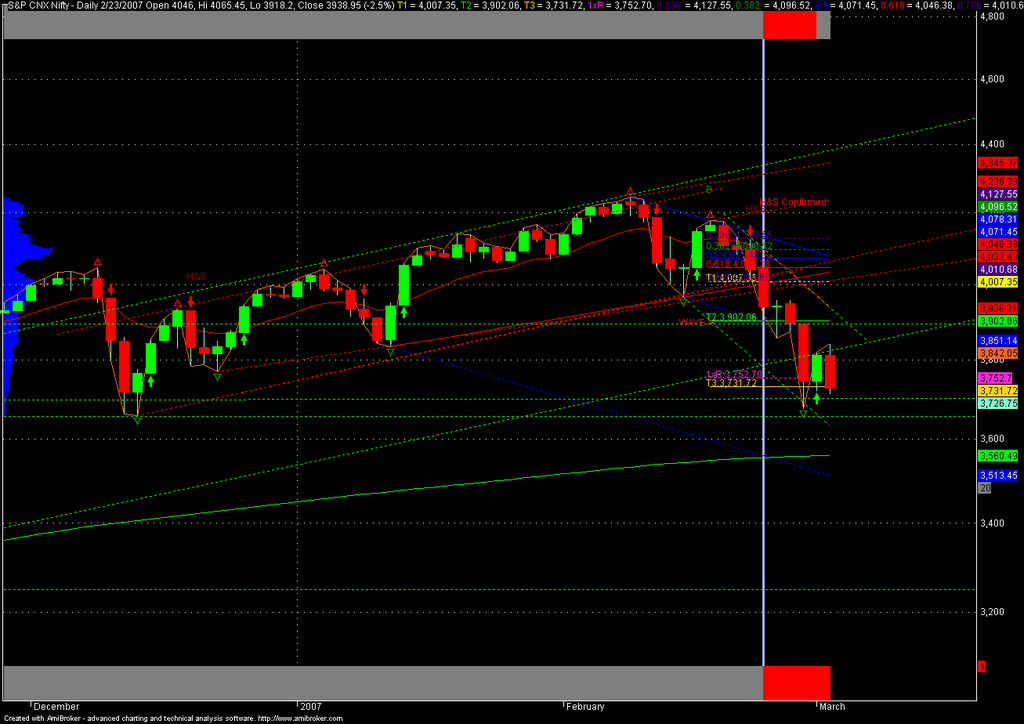
Nifty bullish harami near 3860
Failed to confirm by going above 3965.
I had an extended debate about this with someone.
a) the harami was a near doji hence it denoted uncertainty rather than certainty that market would go up
Even the description of a bullish harami in steve nison's definitive book on candlestick charting is that it often leads to a range rather than a reversal.
So my bullish friend while seeing the bullish harami was ignoring the multiple hns patterns. He refused to see the hns , going to the extent of saying that it was not a hns at all!! Of course I have everything quantified mathematically (the relationship between the left shoulder/right as per my automated pattern recognition system was acceptable)
So anyway what came next??
Instead of rallying above 3965, we broke a declining trendline and did a massive wc/w3 down!!!
I had entered long at 3910 on the day of the bullish harami and when 3965 spot was hit i sold 4050 call for 80 so I was hedged at res.
Next day instead of crossing res!! we started breaking support!!
So of course i shorted below 3880
and hedged by shorting 3800/3760 puts.
I have absolutely no idea what my bullish friends did.
I hope they didn't lose too much though.
As for me I traded the position horribly so the net position is only in a mild profit right now and if I don't watch out soon will have a loss by the end of the month !
since i am short 3760 puts for avg price of 100 and 4050 calls for avg price of 80
and cmp of 3760 put is 100 + rising.
No comments:
Post a Comment